Eight Weeks at Hanwha Aerospace: Defining a Communication Anomaly Before Detecting One
Loading comments...
Loading comments...
From January to February 2026 I spent eight weeks as an intern on Hanwha Aerospace's autonomous software team. I had one job: build a tool that lets anyone see, right away, what got worse and by how much when the link between an unmanned ground vehicle and its control station wobbles. The result is UGV-MON.
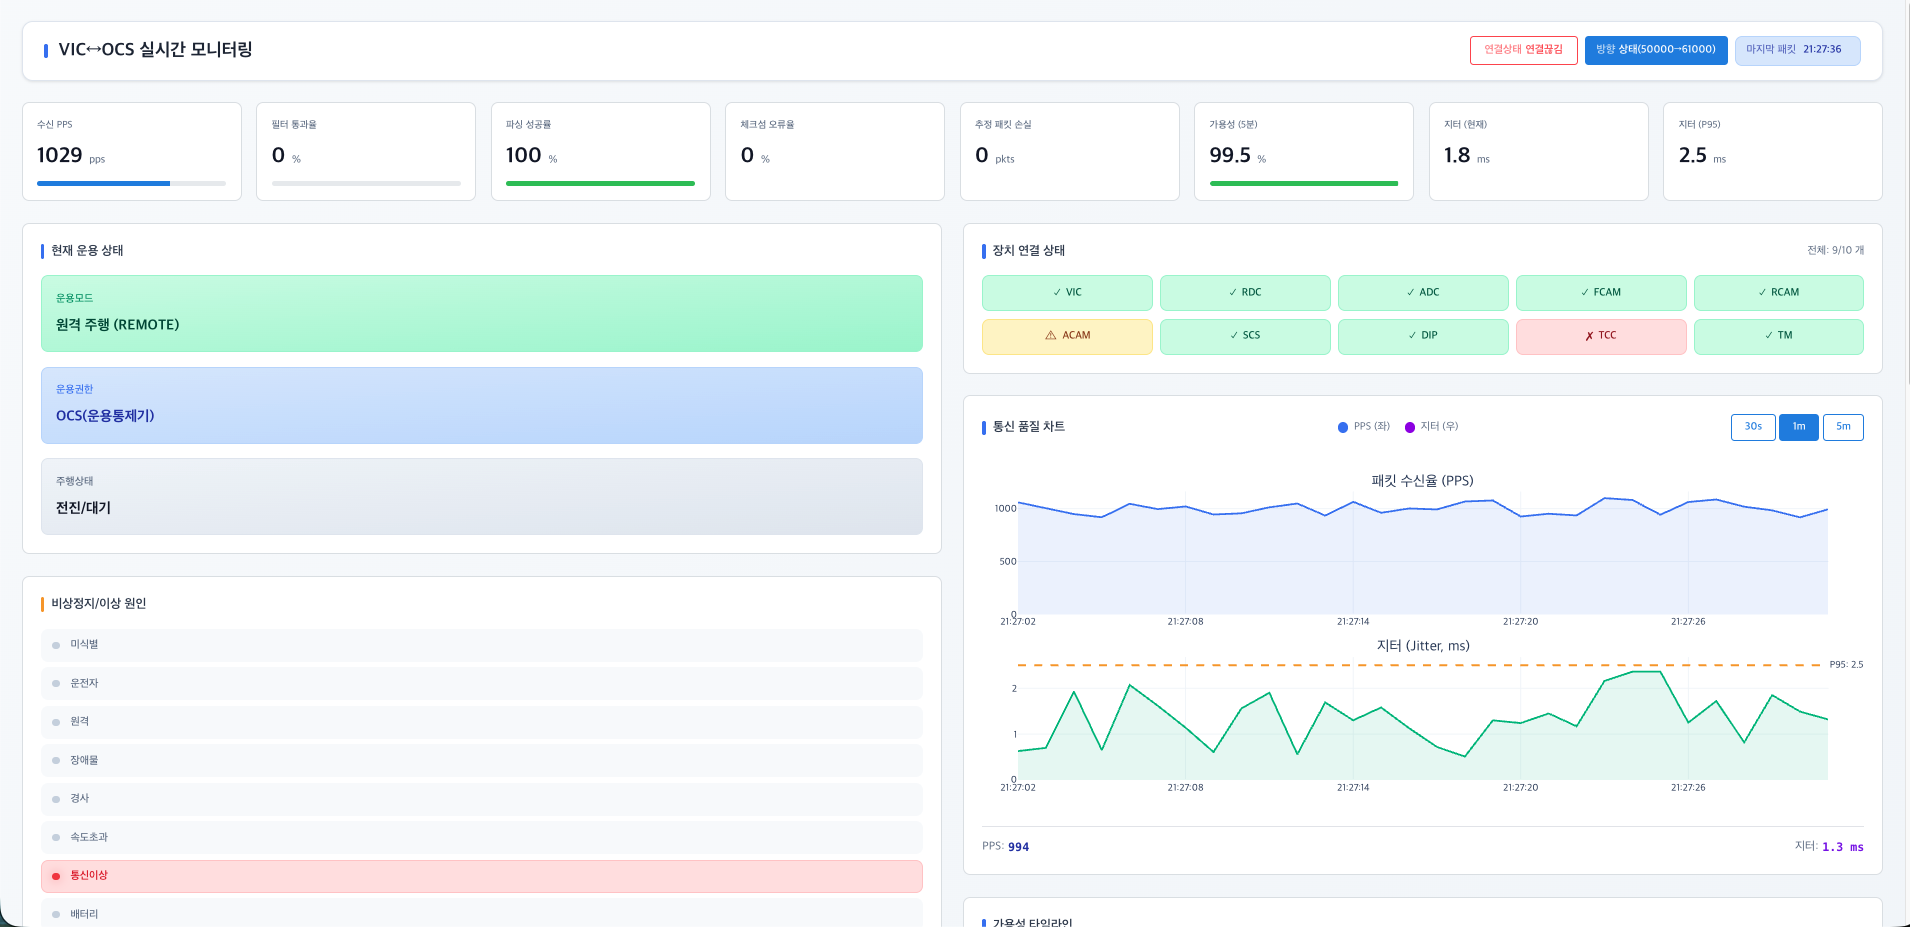
UGV-MON's main screen: communication quality, device status, operating mode and emergency-stop causes in one place.
When the link was unstable, the team could only tell that it had dropped. Finding out why meant opening a packet analyzer every time. There were three requirements:
It ran on an air-gapped Linux network, so collection, analysis and the UI all had to be built from libraries available offline.
To finish in eight weeks while requirements grew, I split the system into layers before writing features.
1[collect]  PacketSniffer → PacketProcessor → ProtocolParser
2    ↓
3[store]    PacketStore (a deque holding one hour)
4    ↓
5[compute]  CaptureService · StatsService · MLService · DashboardBuilder
6    ↓
7[display]  11 real-time panels
Storage only stores, computation only computes, the UI only displays. When I later swapped the storage data structure, nothing above it changed.
The same idea solved developing without hardware: one contract for data providers, followed by both a mock source and live capture, so development and testing continued on days without the vehicle.
1class DataProviderProtocol(Protocol):
2    def get_latest_records(self, n: int) -> list[PacketRecord]: ...
3 def get_kpi_snapshot(self) -> KPISnapshot: ...Packets keep coming while processing lags. Parsing inside the capture loop drops packets. Capture now only enqueues; another thread dequeues and does the heavy parsing.
A protocol on paper, bits on the wire. One wrong endianness marker produced nonsense values. I moved message layouts into data classes, isolated the parser, and tested the parser on its own.
I defined jitter wrong. At first I treated the arrival gap as jitter, but packets arriving exactly every 0.1 s have a 0.1 s gap and zero jitter. Redefined as the change in gap, the graph spikes only when the link actually wobbles. A 95th-percentile value separates momentary spikes from sustained instability.
Appending to pandas one row at a time gets slow. Live data goes into a light deque and becomes a table only when statistics are needed.
Fixed-threshold alarms fired far too often because "normal" differed by network, and supervised learning was impossible with no anomaly data. Isolation Forest works without labels and is light enough for an offline machine.
I designed the features from the protocol's operating patterns: current jitter, 95th-percentile jitter, jitter volatility, packets-per-second trend, loss rate from sequence numbers, and a 0–100 quality score combining jitter and loss.
The model needs data before its judgments mean anything, so three rules (limits on jitter, loss rate and checksum failure) decide from the first second, and the model's score is blended in once enough data has accumulated. The goal was no blind period while the model warms up.
"Anomaly" alone does not get an engineer moving, so every alert shows which indicators left their normal range and by how much, as standardized scores ("jitter spike, z=3.2; packet rate drop, z=2.8"), with a confidence between 0 and 100%.
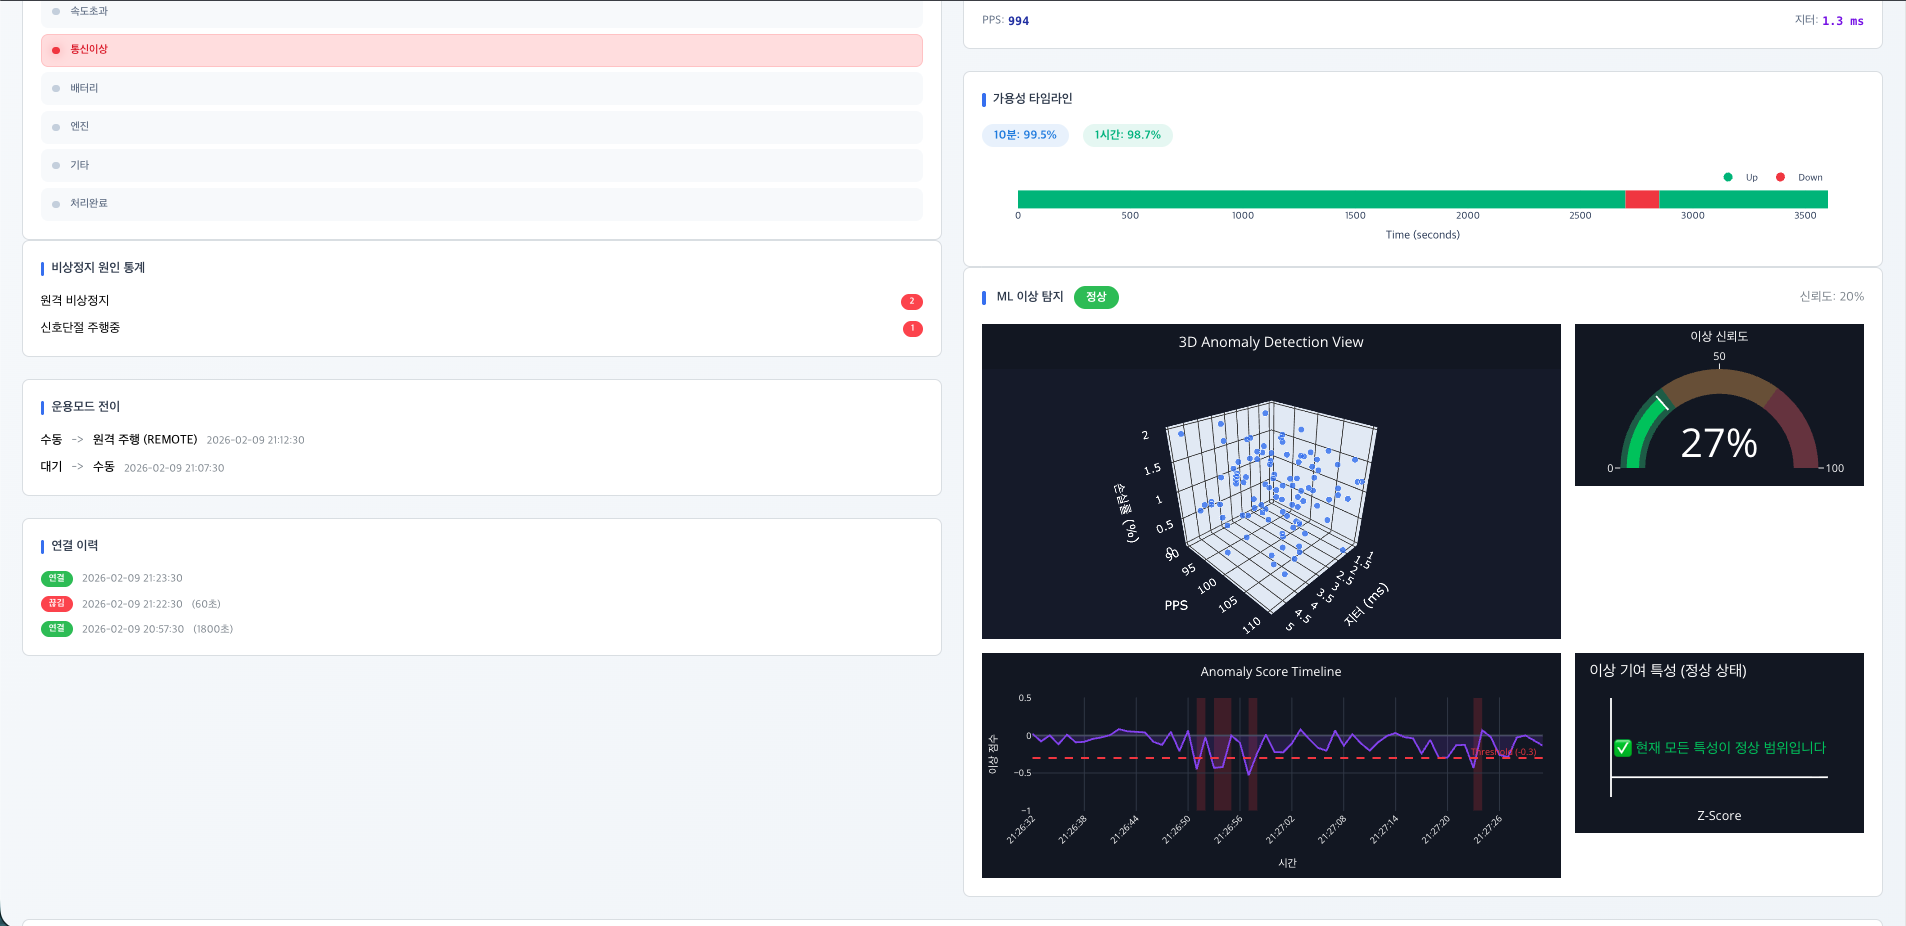
The anomaly panel: 3D scatter, score timeline, confidence and likely causes on one screen.
During testing it flagged the jitter pattern just before a link drop. With no labeled anomalies, I did not turn that observation into an accuracy number.
Near the end, testing in live mode, the UI came up but every graph sat at zero, with no error. Refresh requests went out every two seconds, and capture, processing and storage each looked fine.
Two days later I found it in initialization: the queue the sniffer filled and the queue the processor read were different objects.
1queue_A = PacketQueue()
2sniffer = PacketSniffer(queue=queue_A)      # fills A
3
4queue_B = PacketQueue()
5processor = PacketProcessor(queue=queue_B)  # watches an empty B
I had set up a rule for managing dependencies and then broken it in one place in the startup code. Who creates an object and who receives it has to be decided in one place.
An internal v1.0 prototype: 11 real-time panels, 54 automated tests and nine technical documents. The tests aim at what people miss: protocol boundary values, behavior before and after the model is trained, and sequence numbers wrapping around. I wanted the next person to have evidence that changing it is safe.
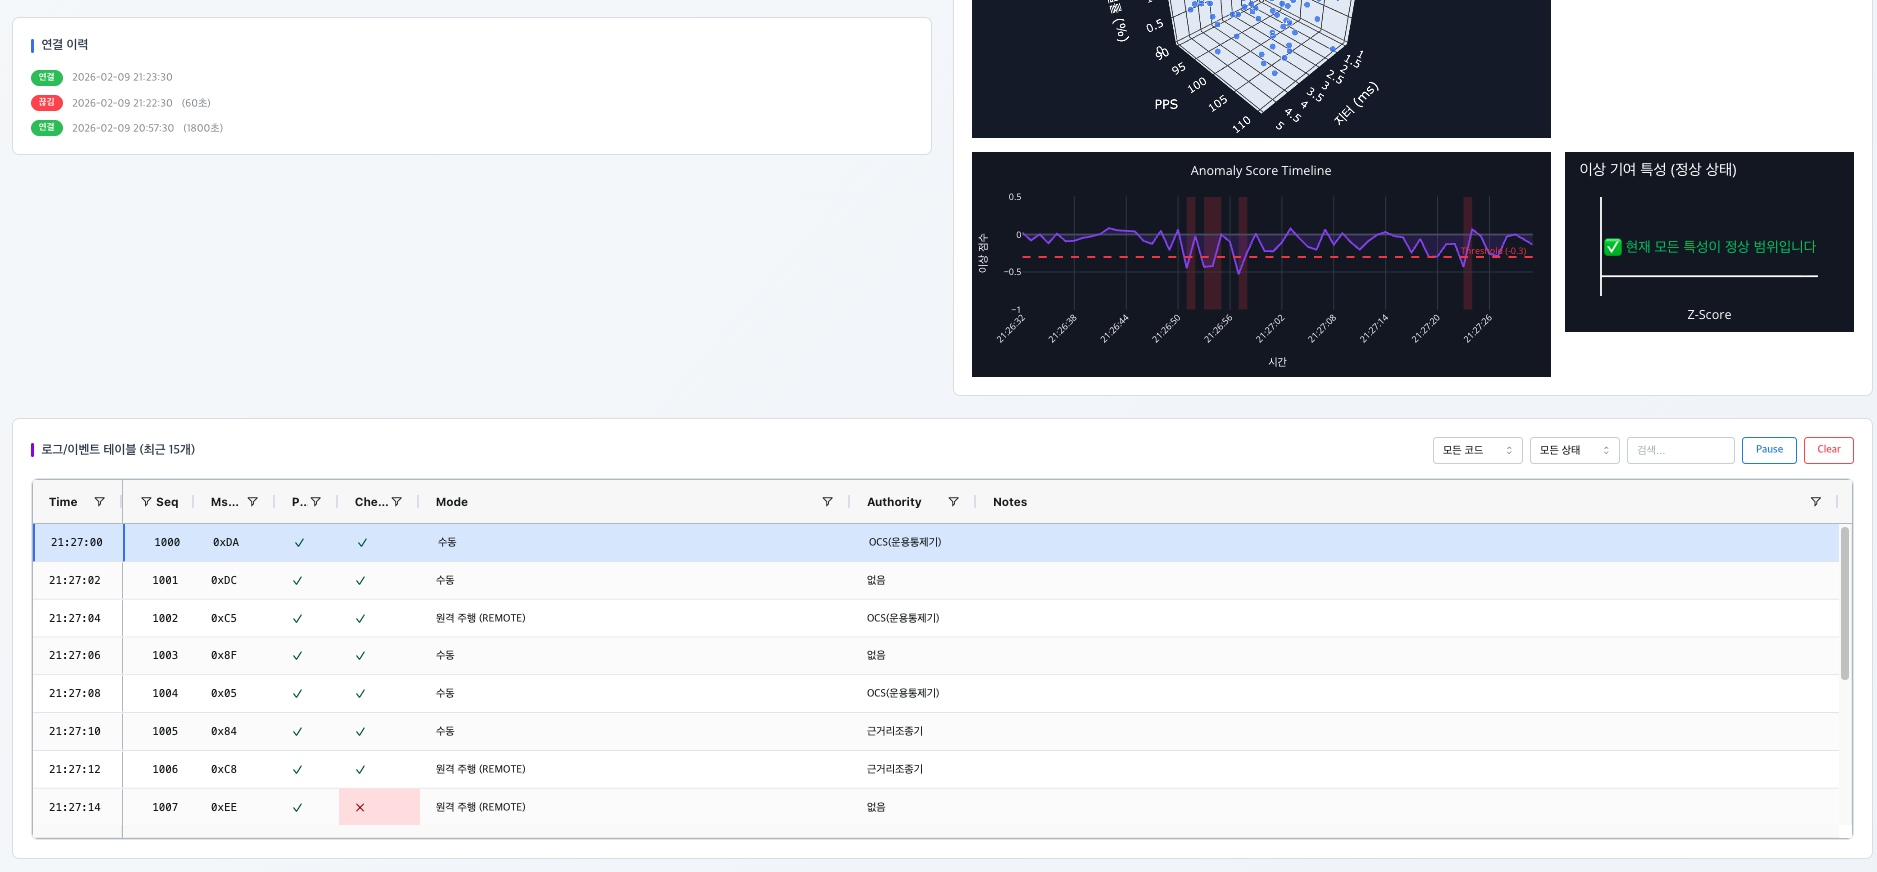
I timed on the receiving side. Every calculation relied on arrival time, so I measured the rate I received, not the rate sent, with processing delay mixed in. Next time: clock synchronization and a high-resolution timer to separate that delay.
I trained on mixed message types. A brief rise in one periodic message spiked the packet rate and the model called it an anomaly. Separate views per message type would be right; how many false alarms that removes needs an experiment.
I never measured performance in numbers. This is the biggest regret. Next time I would build synthetic anomaly scenarios first, such as a sudden packet drop or slowly rising jitter, set a measurable target, and develop against it.
Three things came out of the eight weeks. Setting the structure first let the project absorb requirements that grew halfway through. Tests made changes unafraid. And a system that can explain where it falls short is worth more than one that claims to be finished.
UGV-MON remains an internal tool for seeing changes in link quality that a packet analyzer alone made hard to see.